Capitals: Season Review of Dmitry Orlov, Part 1 of 2

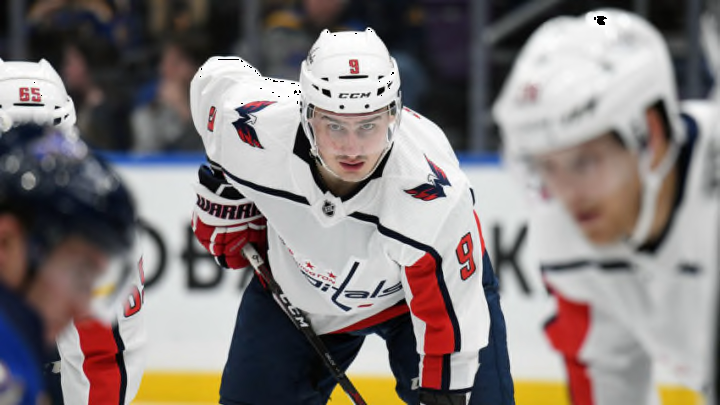
Let’s take a look at Washington Capitals defensemen Dmitry Orlov.
I will be doing a season review of Dmitry Orlov. When Orlov is on his game, he is smothering defensively and aggressive offensively (even though the points may not indicate it).
Coming out of the all-star break, these things were absent from his game. Part of it can be attributed to his changing partners, but he’s also embodied the Capitals overall struggles with getting back up to speed. I thought it’d be a good time to look at his season to date to bring some light to how his recent struggles aren’t a trend of the entire season.
I will be breaking up this review into two parts. First part will include his on-ice stats. The second part will review his individual stats.
More from Editorials
- Alex Ovechkin will score 50 goals in 2023-24
- It’s time for Capitals fans to chill out with the Anthony Mantha hate
- The Capitals Have Several Potentially Bad Contracts
- Nic Dowd looks to show reliability
- Dylan Strome’s Contract Could Be A Steal For The Capitals
Ice time at 5 v 5 is an indicator to how much trust the coach’s have in you as a player. He has almost 1,062 minutes played at 5 v 5 this season.
That is good for 1st on the team, a trend continuing from last season where he led as well. His overall ice time per game is down, 18.31 minutes versus 18.52, but he is still in the lead. His PDO this year over these minutes is .986, better than his 1.002 previously.
With ice time not changing dramatically, we can reasonably compare this season to last.
The stat to look at for overall puck possession is Corsi For percentage, or “total percentage of shots taken throughout a shift weighted against the other team”. This is a slightly misleading stat as far as the Capitals are concerned, as they put more emphasis on creating more High Danger Chances versus overall shots.
To this point he has seen a vast increase in his CF%. He is at 54.25 CF% with 58 games played, last season he was at 48.50%. throughout 82 games. There are only 2 defenseman in the league with more minutes and a higher CF%. Orlov comes in 16th in overall ice time at 5 v 5 across the league.
Shot For percentage (SF%) is better to determine overall defensive play than CF%. Last season, Orlov carried a 47.73 SF%. This season, he is at 53.25 SF%. This is a 5.51% increase from last year. He leads the Capitals’ top 6 defenseman in this stat at 5 v 5.
From last season to this season, there really is not much of a marketable change in his Goals For percentage. He has been in a decline since ’16-’17, where he had 61.54 GF% over 82; for the past two season he has been under 50%. For this season, he sits at 49.50 GF%, basically even with the opponent, last season, 48.18 GF%. Slight increase here, but both seasons under the opponents GF%. For comparison sake, John Carlson is at 55.45 GF%.
Next, Expected Goals For, Expected Goals Against, and Expected Goals For percentage. Orlov is at 47.23 xGF, last season he was at 53.29. His xGA is 40.59 this season, last season, 61.89 xGA. Lastly, he has a 53.78 xGF%, compared to 46.27 xGF%. He has been on the ice for less expected goal plays for the Capitals this year, not great. He has greatly reduced his on ice expected goal plays against, a drastic turnaround. And is on the ice for a greater percentage of the overall expected goal plays for, during his shifts.
Let us compare the Scoring Chances For percentage, High Danger Chances For percentage, and High Danger Goals For percentage. His SCF% this season is 55.22, considerably higher than last years’ 48.21 SCF%. He carries a 50.80 HDCF%, not remarkable, but much better than his 41.35 HDCF% least year. Finally, this season he has a 46.88 HDGF%, last year was at 37.50 HDGF%. He has improved in each one of these stats this season compared to last.
More. Capitals fall to Golden Knights. light
These numbers are adjusted to 5 v 5 play. Also, last seasons numbers are based on 82 games played, this season he sits at 58. The seasons numbers certainly have the chance to regress over the next 24 games, but they can also get better. He has seen improvement to every stat, beside xGF. These stats came from naturalstattrick.com.